ChartEye Q&A
What is ChartEye?
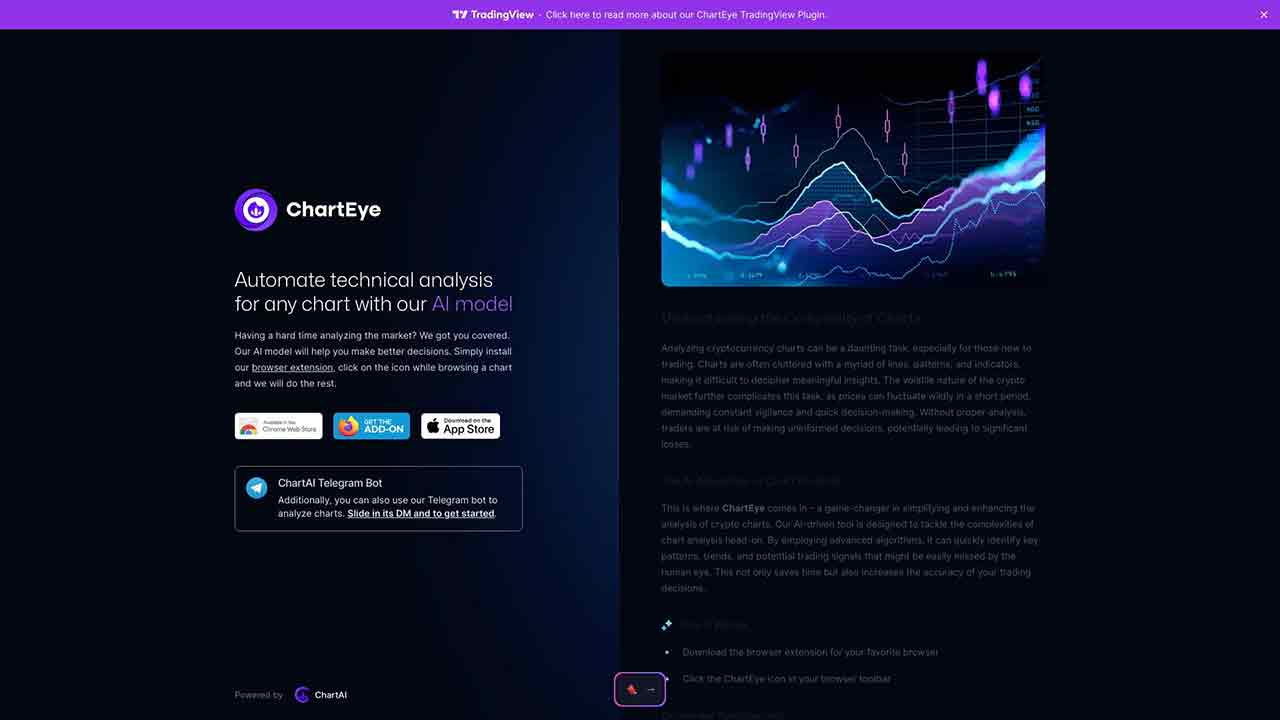
ChartEye generates AI-driven technical analysis reports for every chart with only a few clicks, saving you time and effort. It can quickly identify key patterns, trends, and potential trading signals that might be easily missed by the human eye.
How to use ChartEye?
Download the browser extension or use our Telegram bot to initiate an in-depth chart analysis. Simply click on the ChartEye icon in your browser toolbar or use the TA command in the Telegram bot followed by the ticker symbol or upload your own chart image.
Why was my chart analysis brief or less detailed than expected?
The level of detail in the analysis can vary depending on the complexity and quality of the chart data. It is recommended to use high-quality charts with clear indicators for optimal analysis.
What types of indicators should be present in the chart for optimal analysis?
Charts with a diverse set of technical indicators, such as moving averages, RSI, MACD, and Bollinger Bands, provide more robust analysis results.
How can I ensure the chart I submit is suitable for analysis?
Make sure the chart is clear and includes relevant price and volume data. Avoid charts with missing or incomplete information.
What should I do if the analysis doesn't match my expectations?
ChartEye provides AI-generated analysis based on historical patterns and trends. It's important to remember that no analysis can guarantee future performance. Consider consulting with a financial advisor or conducting further analysis.
Can the tool analyze charts with multiple indicators simultaneously?
Yes, ChartEye can analyze charts with multiple indicators simultaneously, providing a comprehensive analysis of the chart's technical factors.
Is there a specific format or source for the chart that works best with the tool?
ChartEye can analyze charts from various sources, including popular trading platforms and custom chart images. As long as the chart data is clear and contains the necessary information, the tool can provide accurate analysis.
ChartEye's Core Features
ChartEye's Use Cases
ChartEye Traffic
Monthly Visits: 8.7K
Avg.Visit Duration: 00:02:07
Page per Visit: 0.55
Bounce Rate: 42.26%
Dec 2023 - Mar 2024 All Traffic
Geography
Top 5 Regions United States: 9.32%
Russia: 8.61%
Indonesia: 8.56%
Bulgaria: 8.31%
India: 8.06%
Dec 2023 - Mar 2024 Desktop Only
Traffic Sources
Search: 70.53%
Direct: 23.72%
Social: 5.75%
Mail: 0.00%
Referrals: 0.00%
Display Ads: 0.00%
ChartEye Categories: Other