GRID Q&A
What is GRID?
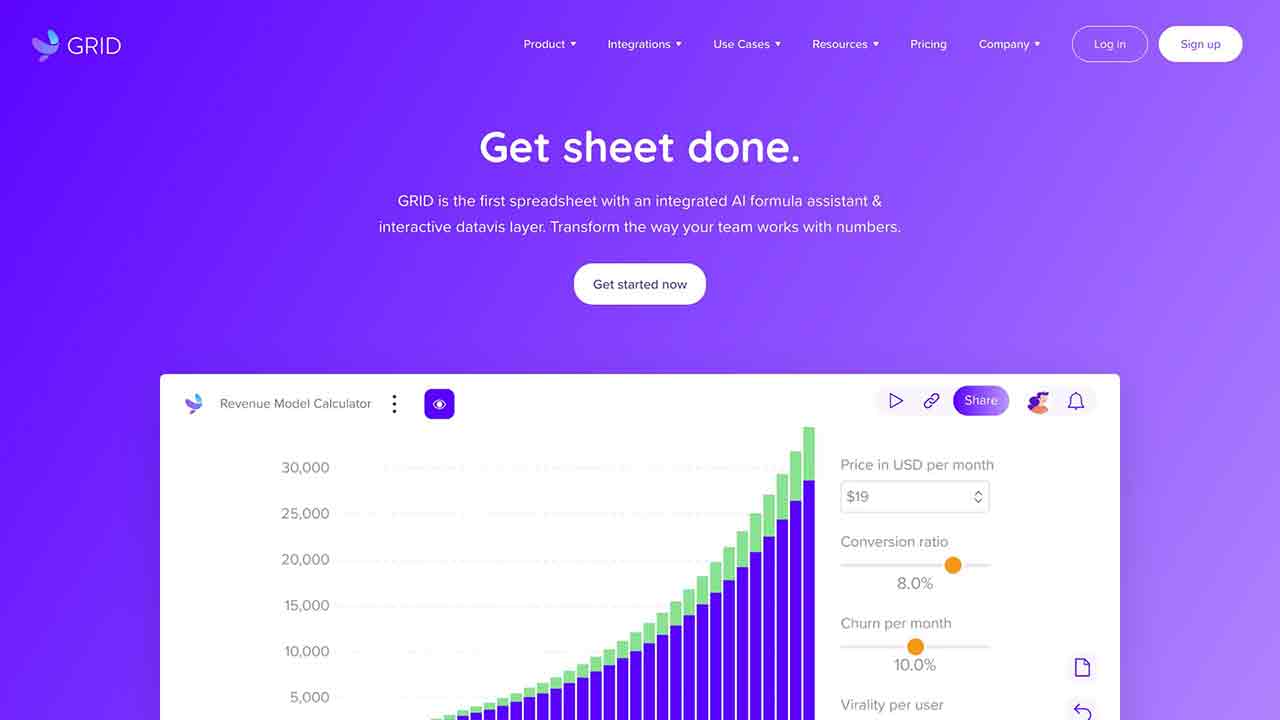
GRID is a smart spreadsheet surface that syncs with and visualizes data from spreadsheets and databases. It provides a familiar spreadsheet interface with powerful integrations for Notion and Airtable.
How to use GRID?
To use GRID, start by building or connecting a spreadsheet or data source. Then, select the data you want to visualize and add interactivity using the built-in spreadsheet editor. GRID allows you to combine data from different sources into one chart and embed your work in websites or internal wikis.
What does GRID do?
GRID is a smart spreadsheet that syncs with and visualizes data from spreadsheets and databases. It allows users to explore interactive analysis, build beautiful reports, collaborate with ease, and make fast, data-driven decisions.
How do I use GRID?
To use GRID, start by building or connecting a spreadsheet or data source. Then, select the data you want to visualize and add interactivity using the built-in spreadsheet editor. GRID allows you to combine data from different sources into one chart and embed your work in websites or internal wikis.
What are the core features of GRID?
GRID's core features include syncing with and visualizing data from spreadsheets and databases, a built-in spreadsheet editor with familiar formulas, powerful integrations for Notion and Airtable, interactive projections and visualizations, the ability to combine data from different sources into one chart, and the option to embed work in websites and internal wikis. It also includes AI assistants for instant formula suggestions and smart chart help.
What are some use cases for GRID?
Some use cases for GRID include building powerful business calculators, creating dynamic financial models, building interactive reports and dashboards for marketing and sales, analyzing campaign performance and tracking KPIs, creating interactive financial reports, and forecasting and projecting revenue.
GRID's Core Features
GRID's Use Cases
GRID Traffic
Monthly Visits: 77.0K
Avg.Visit Duration: 00:01:35
Page per Visit: 3.34
Bounce Rate: 71.83%
Feb 2023 - Mar 2024 All Traffic
Geography
Top 5 Regions United States: 25.11%
Netherlands: 18.26%
United Kingdom: 5.04%
Canada: 4.37%
France: 4.36%
Feb 2023 - Mar 2024 Desktop Only
Traffic Sources
Direct: 55.56%
Search: 32.27%
Referrals: 5.99%
Social: 3.22%
Display Ads: 2.81%
Mail: 0.15%
GRID Categories: AI Product Description Generator