Infography Q&A
What is Infography?
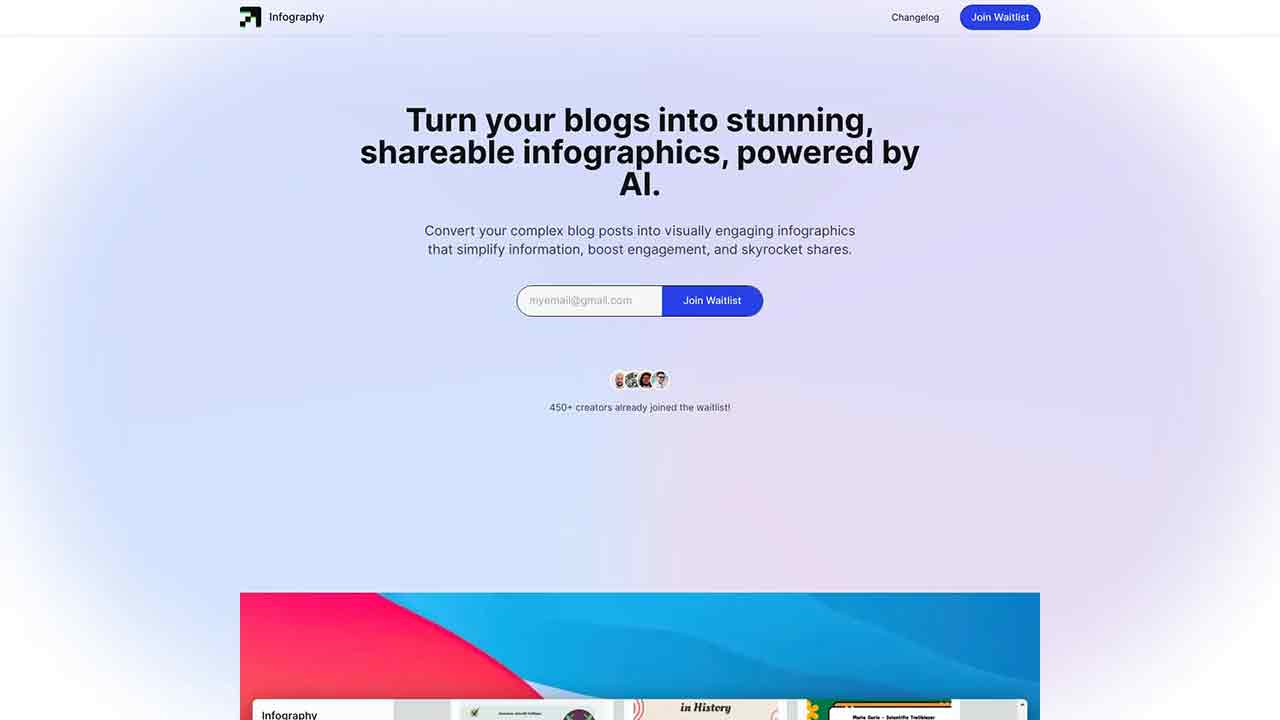
Turn your blogs into stunning, shareable infographics
How to use Infography?
1. Upload your blog post\n2. Select a design template\n3. Customize the infographic\n4. Download and share
Can I customize the design templates?
Yes, you can customize the design templates to match your brand's style.
How long does it take to convert a blog post into an infographic?
The conversion process is fast and automated, taking only a few minutes.
Infography's Core Features
Infography's Use Cases
Infography Traffic
Monthly Visits: 26.9K
Avg.Visit Duration: 00:00:14
Page per Visit: 1.12
Bounce Rate: 94.82%
Dec 2023 - Mar 2024 All Traffic
Geography
Top 5 Regions Germany: 21.56%
United States: 12.91%
Turkey: 11.17%
India: 10.98%
United Kingdom: 8.50%
Dec 2023 - Mar 2024 Desktop Only
Traffic Sources
Referrals: 60.04%
Direct: 26.01%
Social: 13.00%
Search: 0.96%
Mail: 0.00%
Display Ads: 0.00%
Infography Categories: AI Photo & Image Generator