Out Of The Blue Q&A
What is Out Of The Blue?
Out of the Blue's, B2B Continuous AI-driven SaaS Intelligence Platform works for you 24*7 behind the scenes to drive time-critical interventions - so that D2C companies can do what they do best - understand their customers and deliver delightful experiences.
How to use Out Of The Blue?
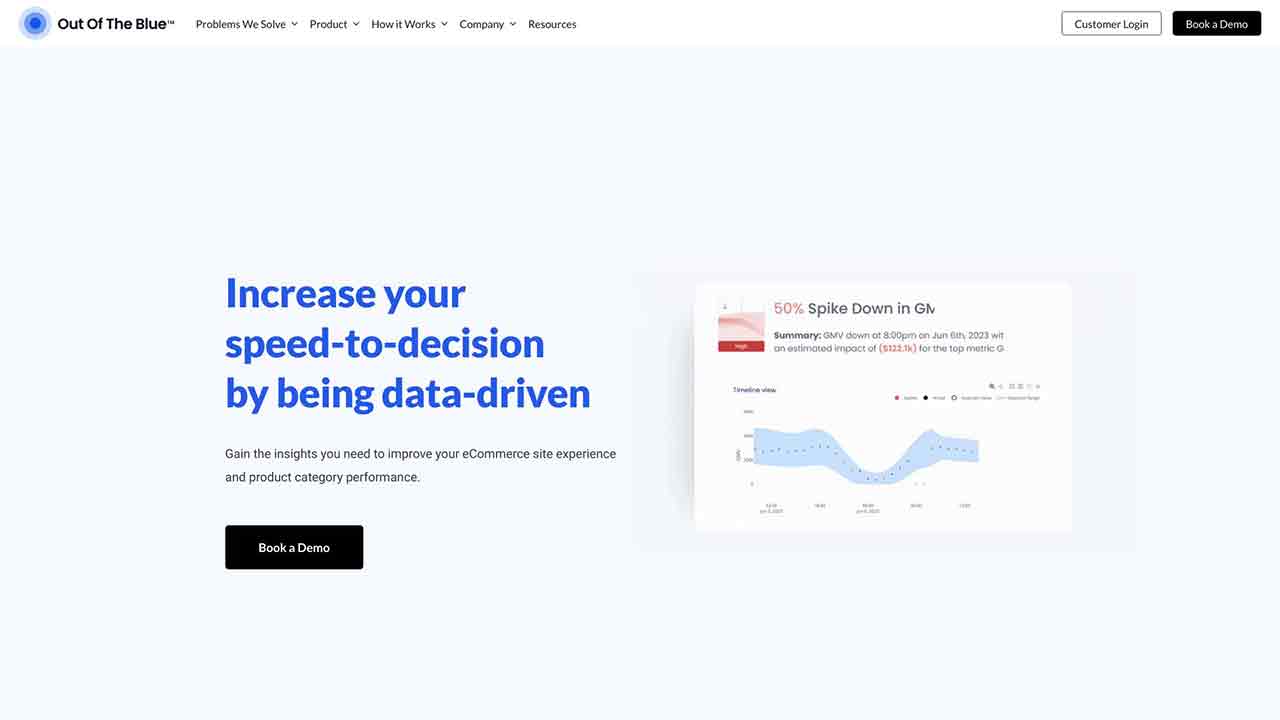
Out Of The Blue is an eCommerce Revenue OS that helps companies drive impact by providing insights, continuous monitoring, and prioritization of issues based on their business impact. It works behind the scenes to assist data analysts and growth teams in improving their eCommerce site experience and product category performance.
What is Out Of The Blue?
Out Of The Blue is an eCommerce Revenue OS that provides insights, continuous monitoring, and issue prioritization based on business impact to drive impact for D2C companies.
How does Out Of The Blue work?
Out Of The Blue works behind the scenes using AI-driven technology to assist data analysts and growth teams in improving eCommerce site experience and product category performance.
What are the core features of Out Of The Blue?
The core features of Out Of The Blue include continuous monitoring, identifying site errors and drop off points, uncovering outperforming and soft categories, prioritizing issues based on business impact, and generating weekly digests of revenue impacting issues.
What are the use cases for Out Of The Blue?
Out Of The Blue can be used to increase revenue, improve speed-to-decision, and reduce costs for D2C companies.
Out Of The Blue's Core Features
Out Of The Blue's Use Cases
Out Of The Blue Traffic
Monthly Visits: < 5K
Avg.Visit Duration: 00:01:20
Page per Visit: 0.49
Bounce Rate: 33.76%
Jun 2023 - Mar 2024 All Traffic
Geography
Top 5 Regions United States: 19.16%
Turkey: 16.53%
India: 16.50%
Argentina: 15.14%
Vietnam: 14.33%
Jun 2023 - Mar 2024 Desktop Only
Traffic Sources
Search: 64.50%
Direct: 21.63%
Referrals: 13.87%
Mail: 0.00%
Social: 0.00%
Display Ads: 0.00%
Out Of The Blue Categories: AI Analytics Assistant