Piktochart Q&A
What is Piktochart?
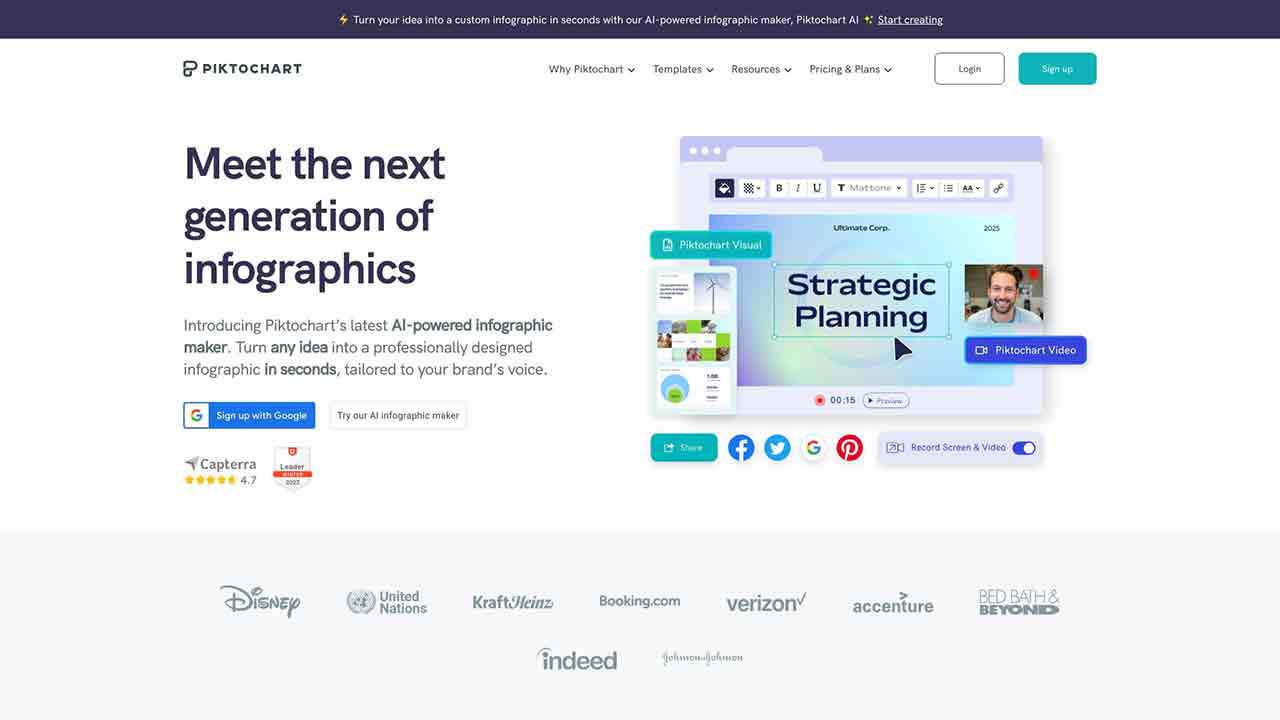
Piktochart is an infographic maker that allows you to create professional-looking infographics, flyers, posters, reports, newsletters, and charts. No design experience is needed.
How to use Piktochart?
With Piktochart, you can quickly create visually appealing designs without any design training. Simply use the drag and drop editor to create infographics, brochures, presentations, and more. Download your visual content in various formats and share them with colleagues or use them in offline presentations.
Do I need design experience to use Piktochart?
No, Piktochart is designed for users with no design experience. The drag and drop editor makes it easy to create professional-looking designs.
What file formats can I download my visual content in?
You can download your visual content in PNG and PDF formats for images, and PPT for presentations.
Can I integrate Piktochart into my current workflow?
Yes, you can download your visual content and share it with colleagues via email. You can also use presentation software like Powerpoint to present offline.
Can I turn complex data into visualizations?
Yes, Piktochart allows you to copy-paste your data into their graph maker, upload a CSV or Excel file, or link up a Google sheet to create clear and understandable data visualizations.
Does Piktochart offer a free plan?
Yes, Piktochart offers a free plan with basic features and limited templates.
Piktochart's Core Features
Piktochart's Use Cases
Piktochart Traffic
Monthly Visits: 1.3M
Avg.Visit Duration: 00:03:46
Page per Visit: 4.31
Bounce Rate: 45.99%
Sep 2023 - Mar 2024 All Traffic
Geography
Top 5 Regions United States: 21.73%
Mexico: 9.61%
India: 7.65%
Colombia: 5.87%
Philippines: 3.64%
Sep 2023 - Mar 2024 Desktop Only
Traffic Sources
Search: 59.78%
Direct: 31.32%
Referrals: 3.34%
Social: 3.04%
Display Ads: 1.66%
Mail: 0.86%
Piktochart Categories: AI Product Description Generator