Tablize Q&A
What is Tablize?
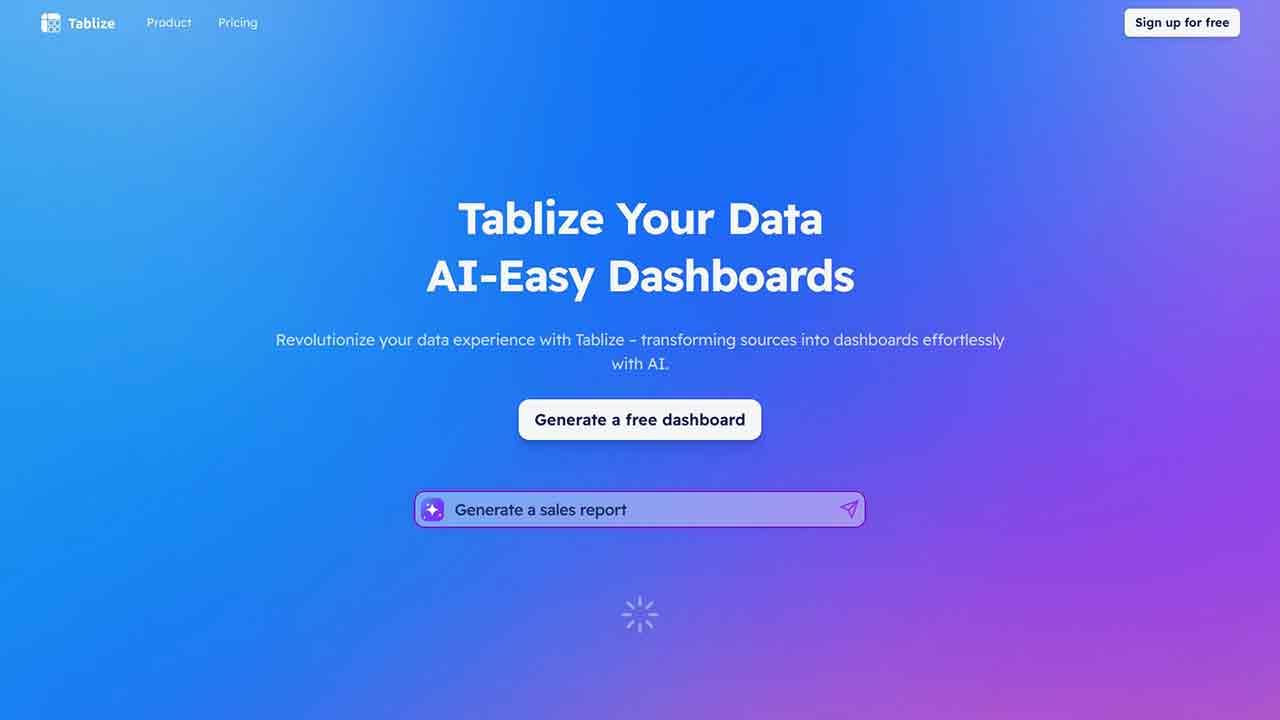
Tablize transforms complex data integration into simple, AI-powered dashboards with intuitive slash commands. It offers real-time data visualization, making it accessible for all skill levels. This tool redefines dashboard creation, replacing traditional methods with a more efficient, user-friendly approach.
How to use Tablize?
Tablize allows you to turn your data into dashboards effortlessly. Simply import data from any source like spreadsheets, databases, ERPs or CRMs. Then, craft formulas to automate repetitive tasks and unlock real-time visibility into key metrics.
What is Tablize?
Tablize is a tool that transforms complex data into simple, AI-powered dashboards with intuitive slash commands. It offers real-time data visualization for users of all skill levels, making dashboard creation more efficient and user-friendly.
How does Tablize import data?
Tablize can automatically import data from any source, including spreadsheets, databases, ERPs, and CRMs. This allows users to access all their data sources in one place and easily create comprehensive dashboards.
Can Tablize automate repetitive tasks?
Yes, Tablize allows users to craft formulas to automate repetitive spreadsheet tasks. This frees up time for users to focus on more strategic work rather than manual data processing.
Can Tablize provide real-time visibility into key metrics?
Absolutely. Tablize offers real-time dashboards, automated reports on a schedule, and alerts when key metrics change. Users can stay informed and make data-driven decisions in a timely manner.
How can I sign up for Tablize?
You can sign up for Tablize by visiting our website and clicking on the 'Sign up for free' button. Get started now and experience the power of Tablize in transforming your data into insightful dashboards.
Tablize's Core Features
Tablize Traffic
Monthly Visits: < 5K
Avg.Visit Duration: 00:00:50
Page per Visit: 0.75
Bounce Rate: 23.29%
Oct 2023 - Mar 2024 All Traffic
Geography
Top 5 Regions Malaysia: 20.23%
India: 19.08%
United States: 15.25%
France: 10.33%
Taiwan: 9.49%
Oct 2023 - Mar 2024 Desktop Only
Traffic Sources
Direct: 68.22%
Search: 20.10%
Referrals: 11.68%
Mail: 0.00%
Social: 0.00%
Display Ads: 0.00%
Tablize Categories: AI Product Description Generator