VisualizeAI Q&A
What is VisualizeAI?
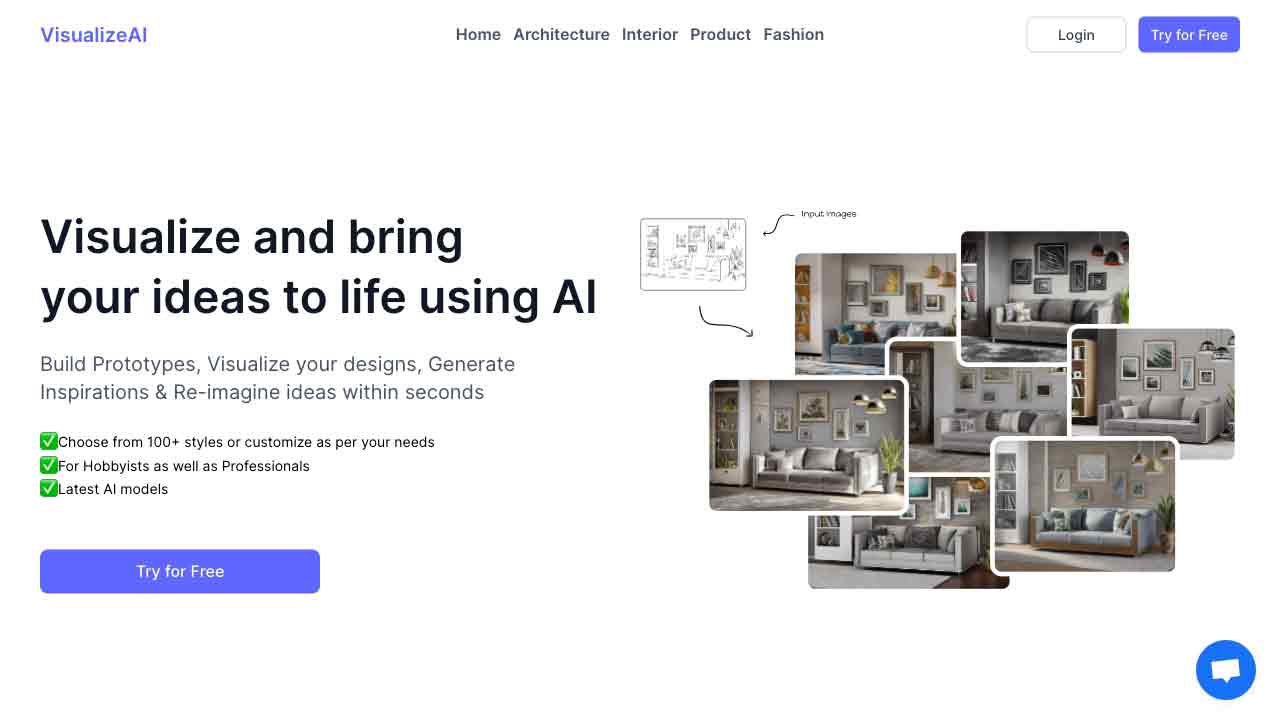
VisualizeAI is a web platform that enables users to quickly build prototypes, visualize their designs, generate inspirations, and reimagine ideas within seconds.
How to use VisualizeAI?
To use VisualizeAI, simply sign up for an account on the website. After logging in, you can start building prototypes by selecting pre-designed templates or creating custom designs from scratch. The platform offers an intuitive drag-and-drop interface, allowing you to easily add elements, text, images, and animations to your prototypes. Additionally, you can use the AI-powered inspiration generator to explore new design ideas. With VisualizeAI, you can iterate and refine your designs, share them with others for feedback, and export them in various file formats.
Is VisualizeAI suitable for beginners?
Yes, VisualizeAI is designed to be user-friendly and intuitive, making it suitable for users of all skill levels.
Can I collaborate with others on my designs?
Absolutely! VisualizeAI allows you to collaborate with team members or clients by sharing your designs and collecting feedback in real-time.
What file formats can I export my designs in?
VisualizeAI supports exporting designs in formats such as PNG, JPEG, SVG, PDF, and HTML.
Can I import my own designs into VisualizeAI?
Currently, VisualizeAI only supports creating designs within the platform and does not provide direct importing of external designs.
Does VisualizeAI offer a free trial?
Please refer to the pricing section on the website to check if a free trial is available.
VisualizeAI's Core Features
VisualizeAI's Use Cases
VisualizeAI Traffic
Monthly Visits: 13.0K
Avg.Visit Duration: 00:01:07
Page per Visit: 1.31
Bounce Rate: 33.84%
Dec 2022 - Mar 2024 All Traffic
Geography
Top 5 Regions United States: 11.60%
Turkey: 7.79%
Indonesia: 7.76%
Brazil: 6.50%
Mexico: 5.72%
Dec 2022 - Mar 2024 Desktop Only
Traffic Sources
Search: 54.84%
Referrals: 30.38%
Direct: 14.77%
Mail: 0.00%
Social: 0.00%
Display Ads: 0.00%
VisualizeAI Categories: Other